Code Climate - Velocity UI
Code Climate Velocity is an Engineering Intelligence platform, to help give Engineering Managers insights on how their engineering teams are doing by pulling data and metrics on their performance. Velocity turns data from commits, pull requests and code into insights you can lean on and lead with. It can improve your team's effectiveness sprint-to-sprint, month-to-month, and quarter-to-quarter.
People Report
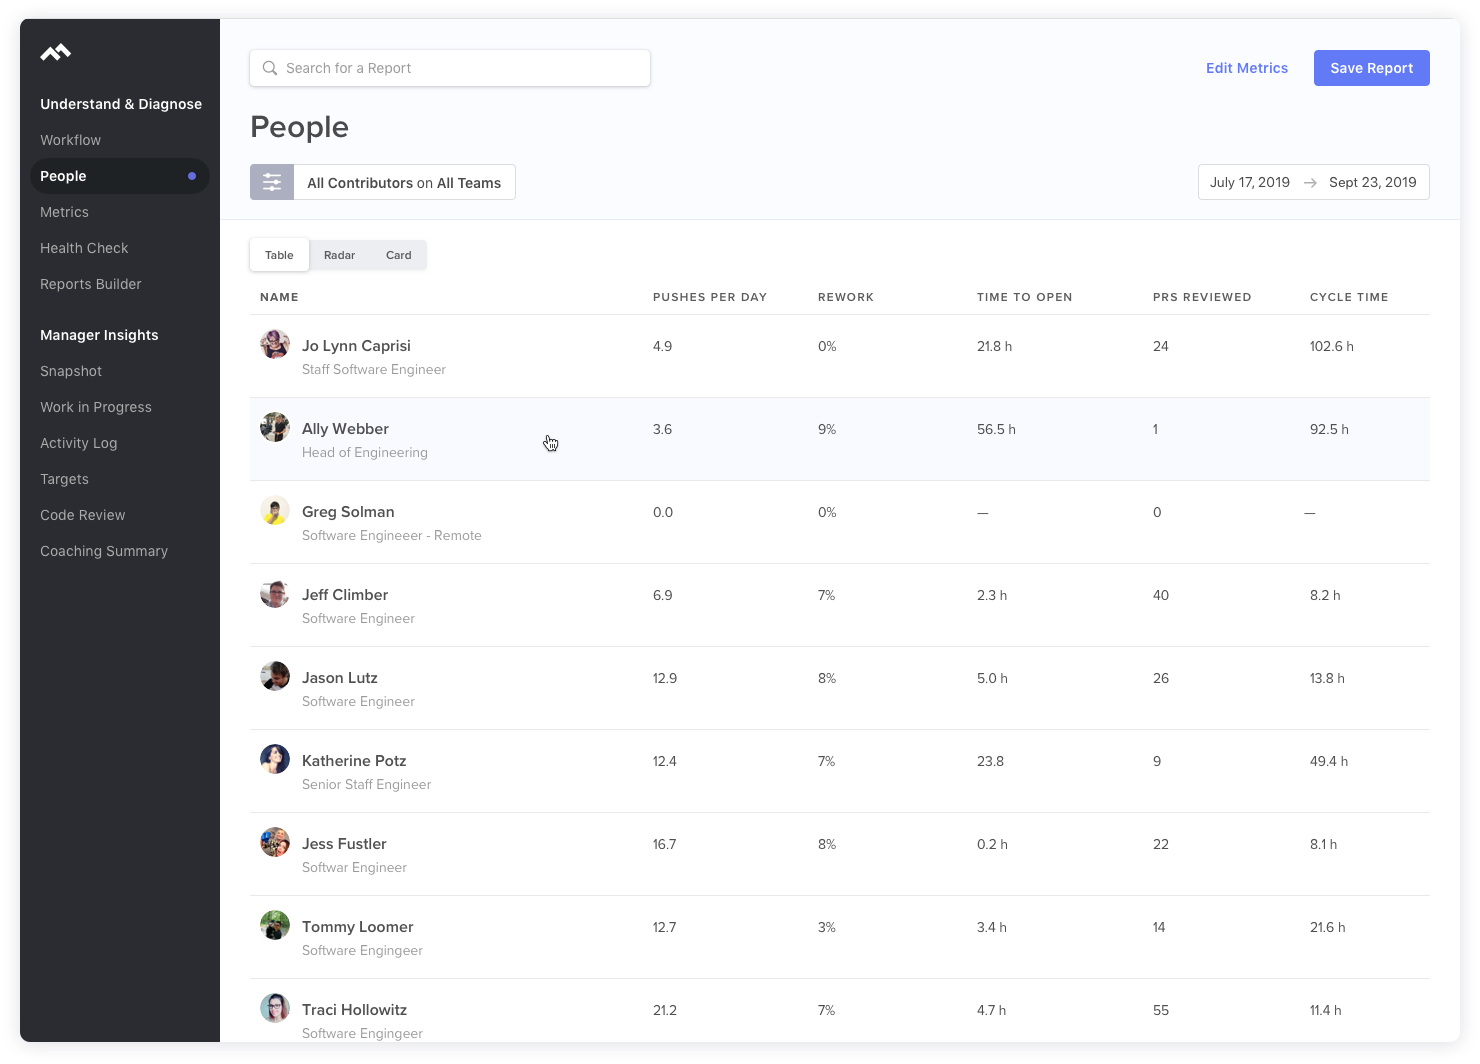
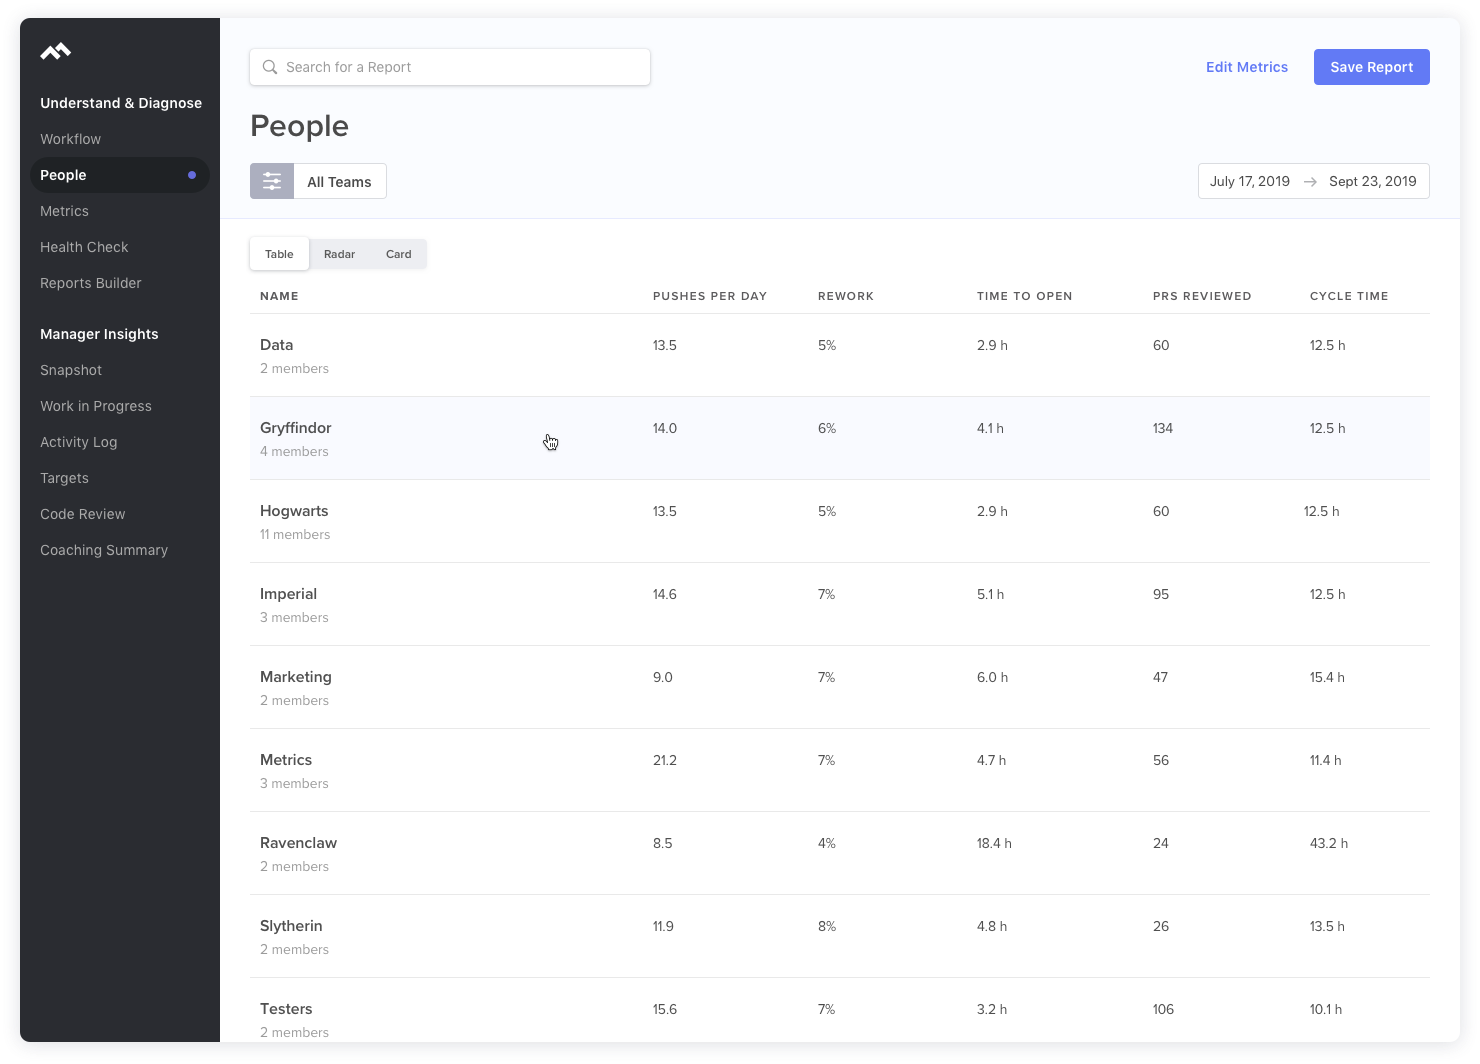
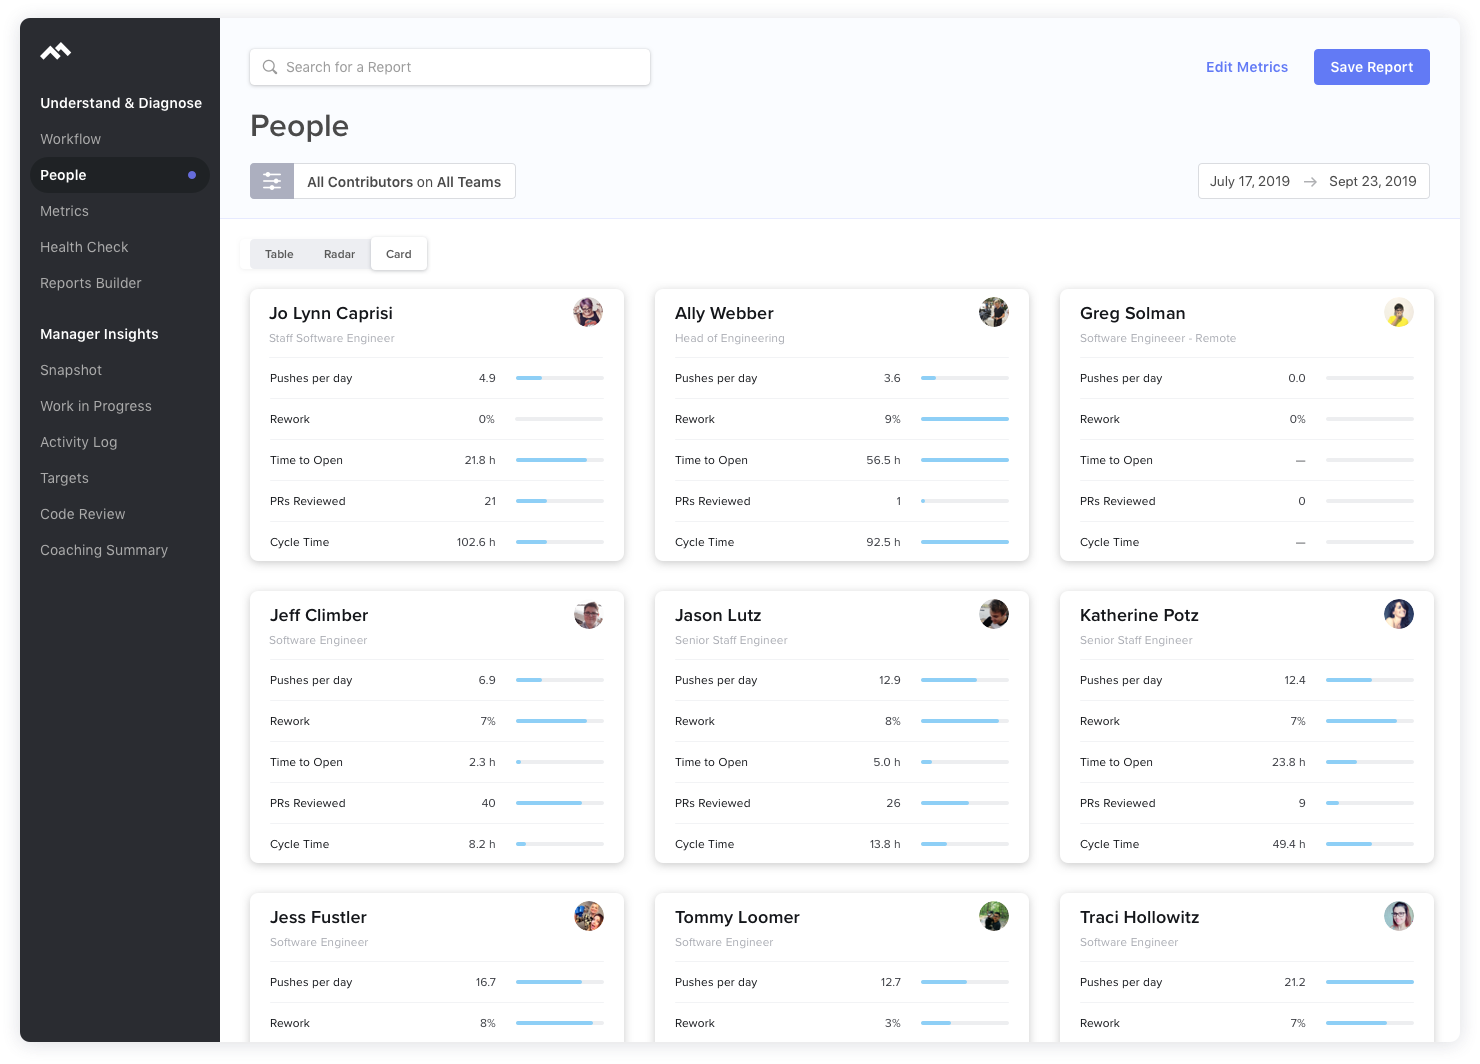
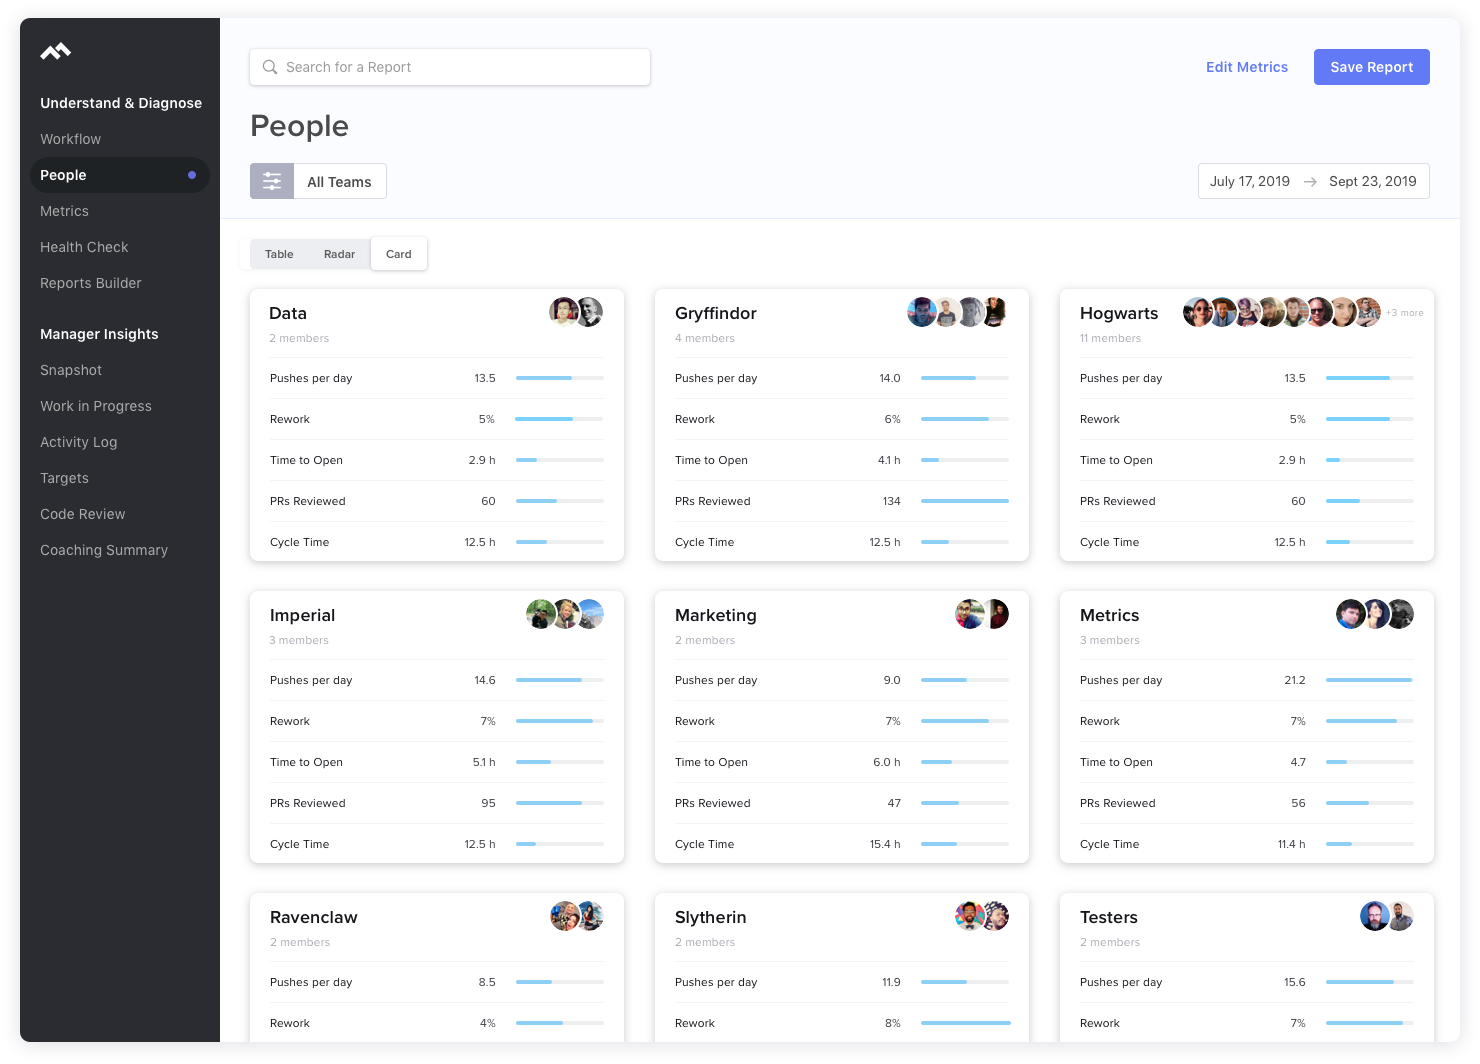
The People report, combines all contributors and teams into one centralized hub. Prior to this page we had two separate pages for both, teams and contributors. There is now 3 different viewing options: List, Radar, and Card view. All showcasing the same chosen metrics, but with different displays that compare each team or contributor against the org’s average.
While all engineers work differently, no one exists in a vacuum. Understand how metrics compare by squad, team, or role to better define growth benchmarks and baseline expectations.
Previous Teams + Contributor Reports
Table View
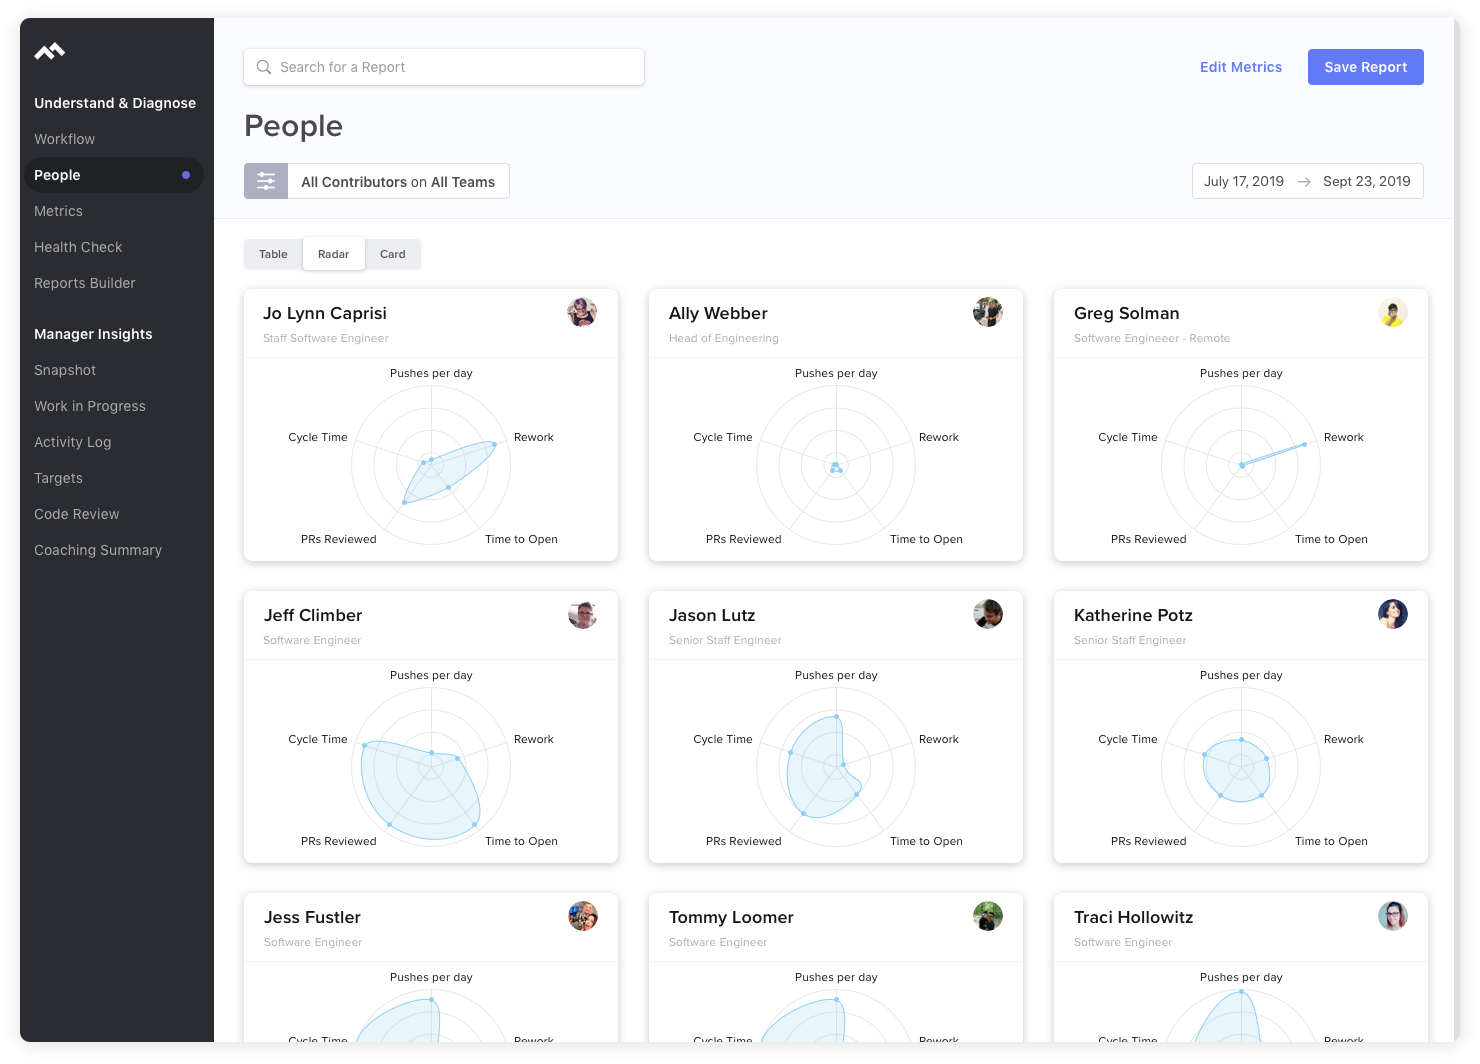
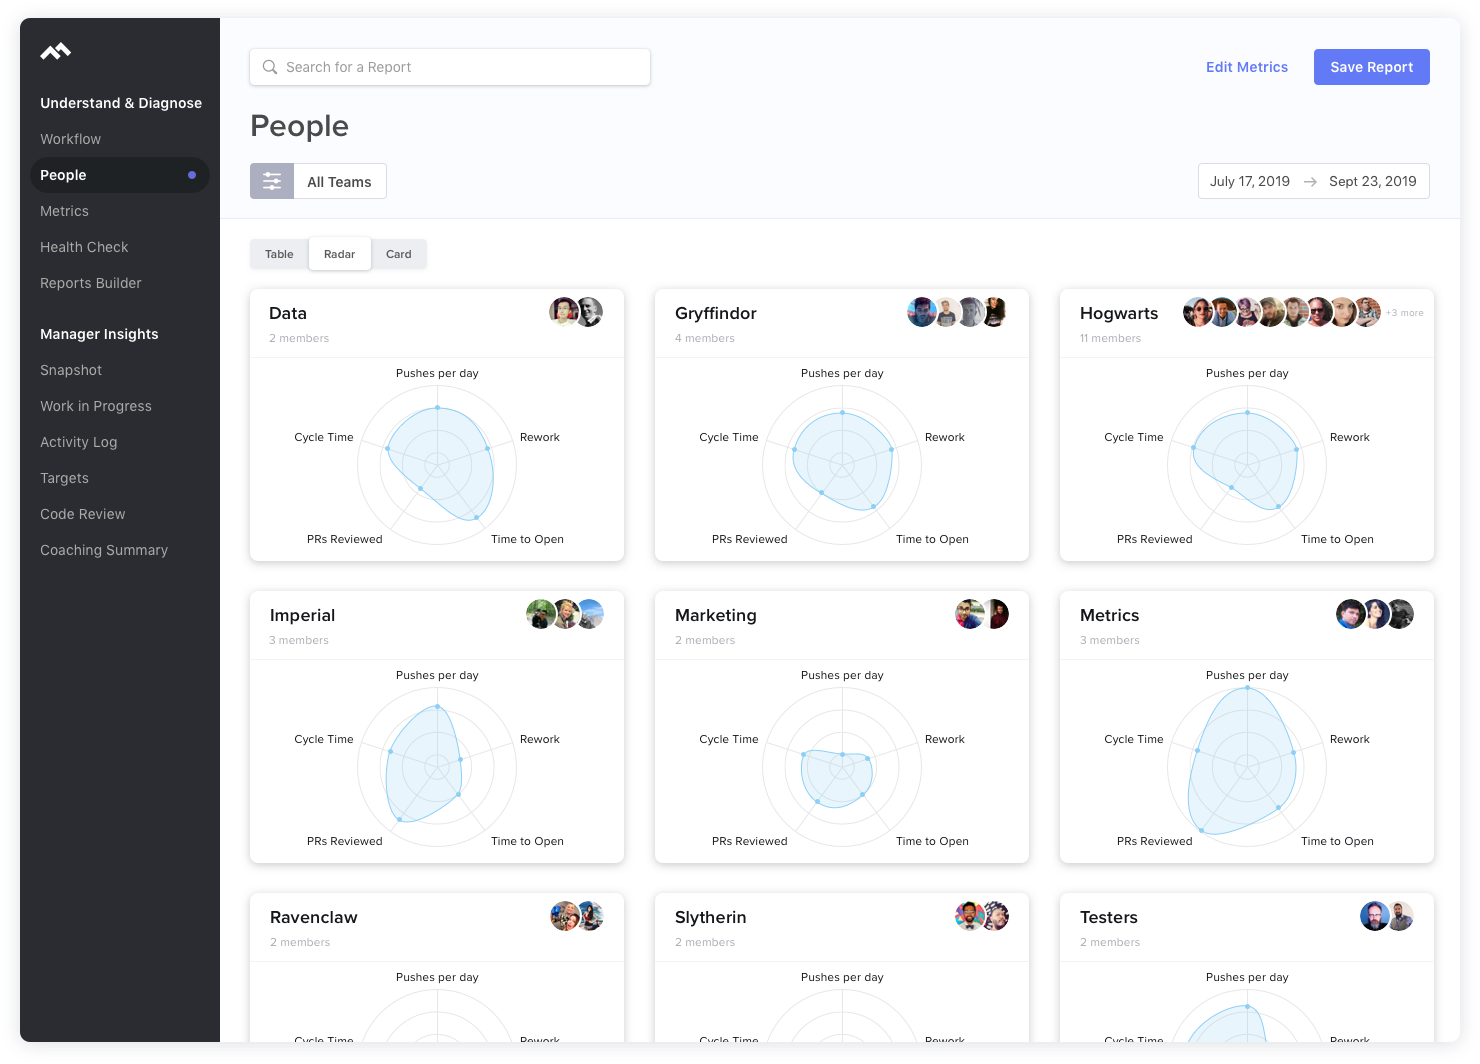
Radar View
Card View
People Report - Edit Metics
Being that there are so many metrics to choose from on the People Report, my next task was to redesign the Edit Metrics experience. To allow our users to pick which metrics they would like to view, and customize them in whichever order they like.

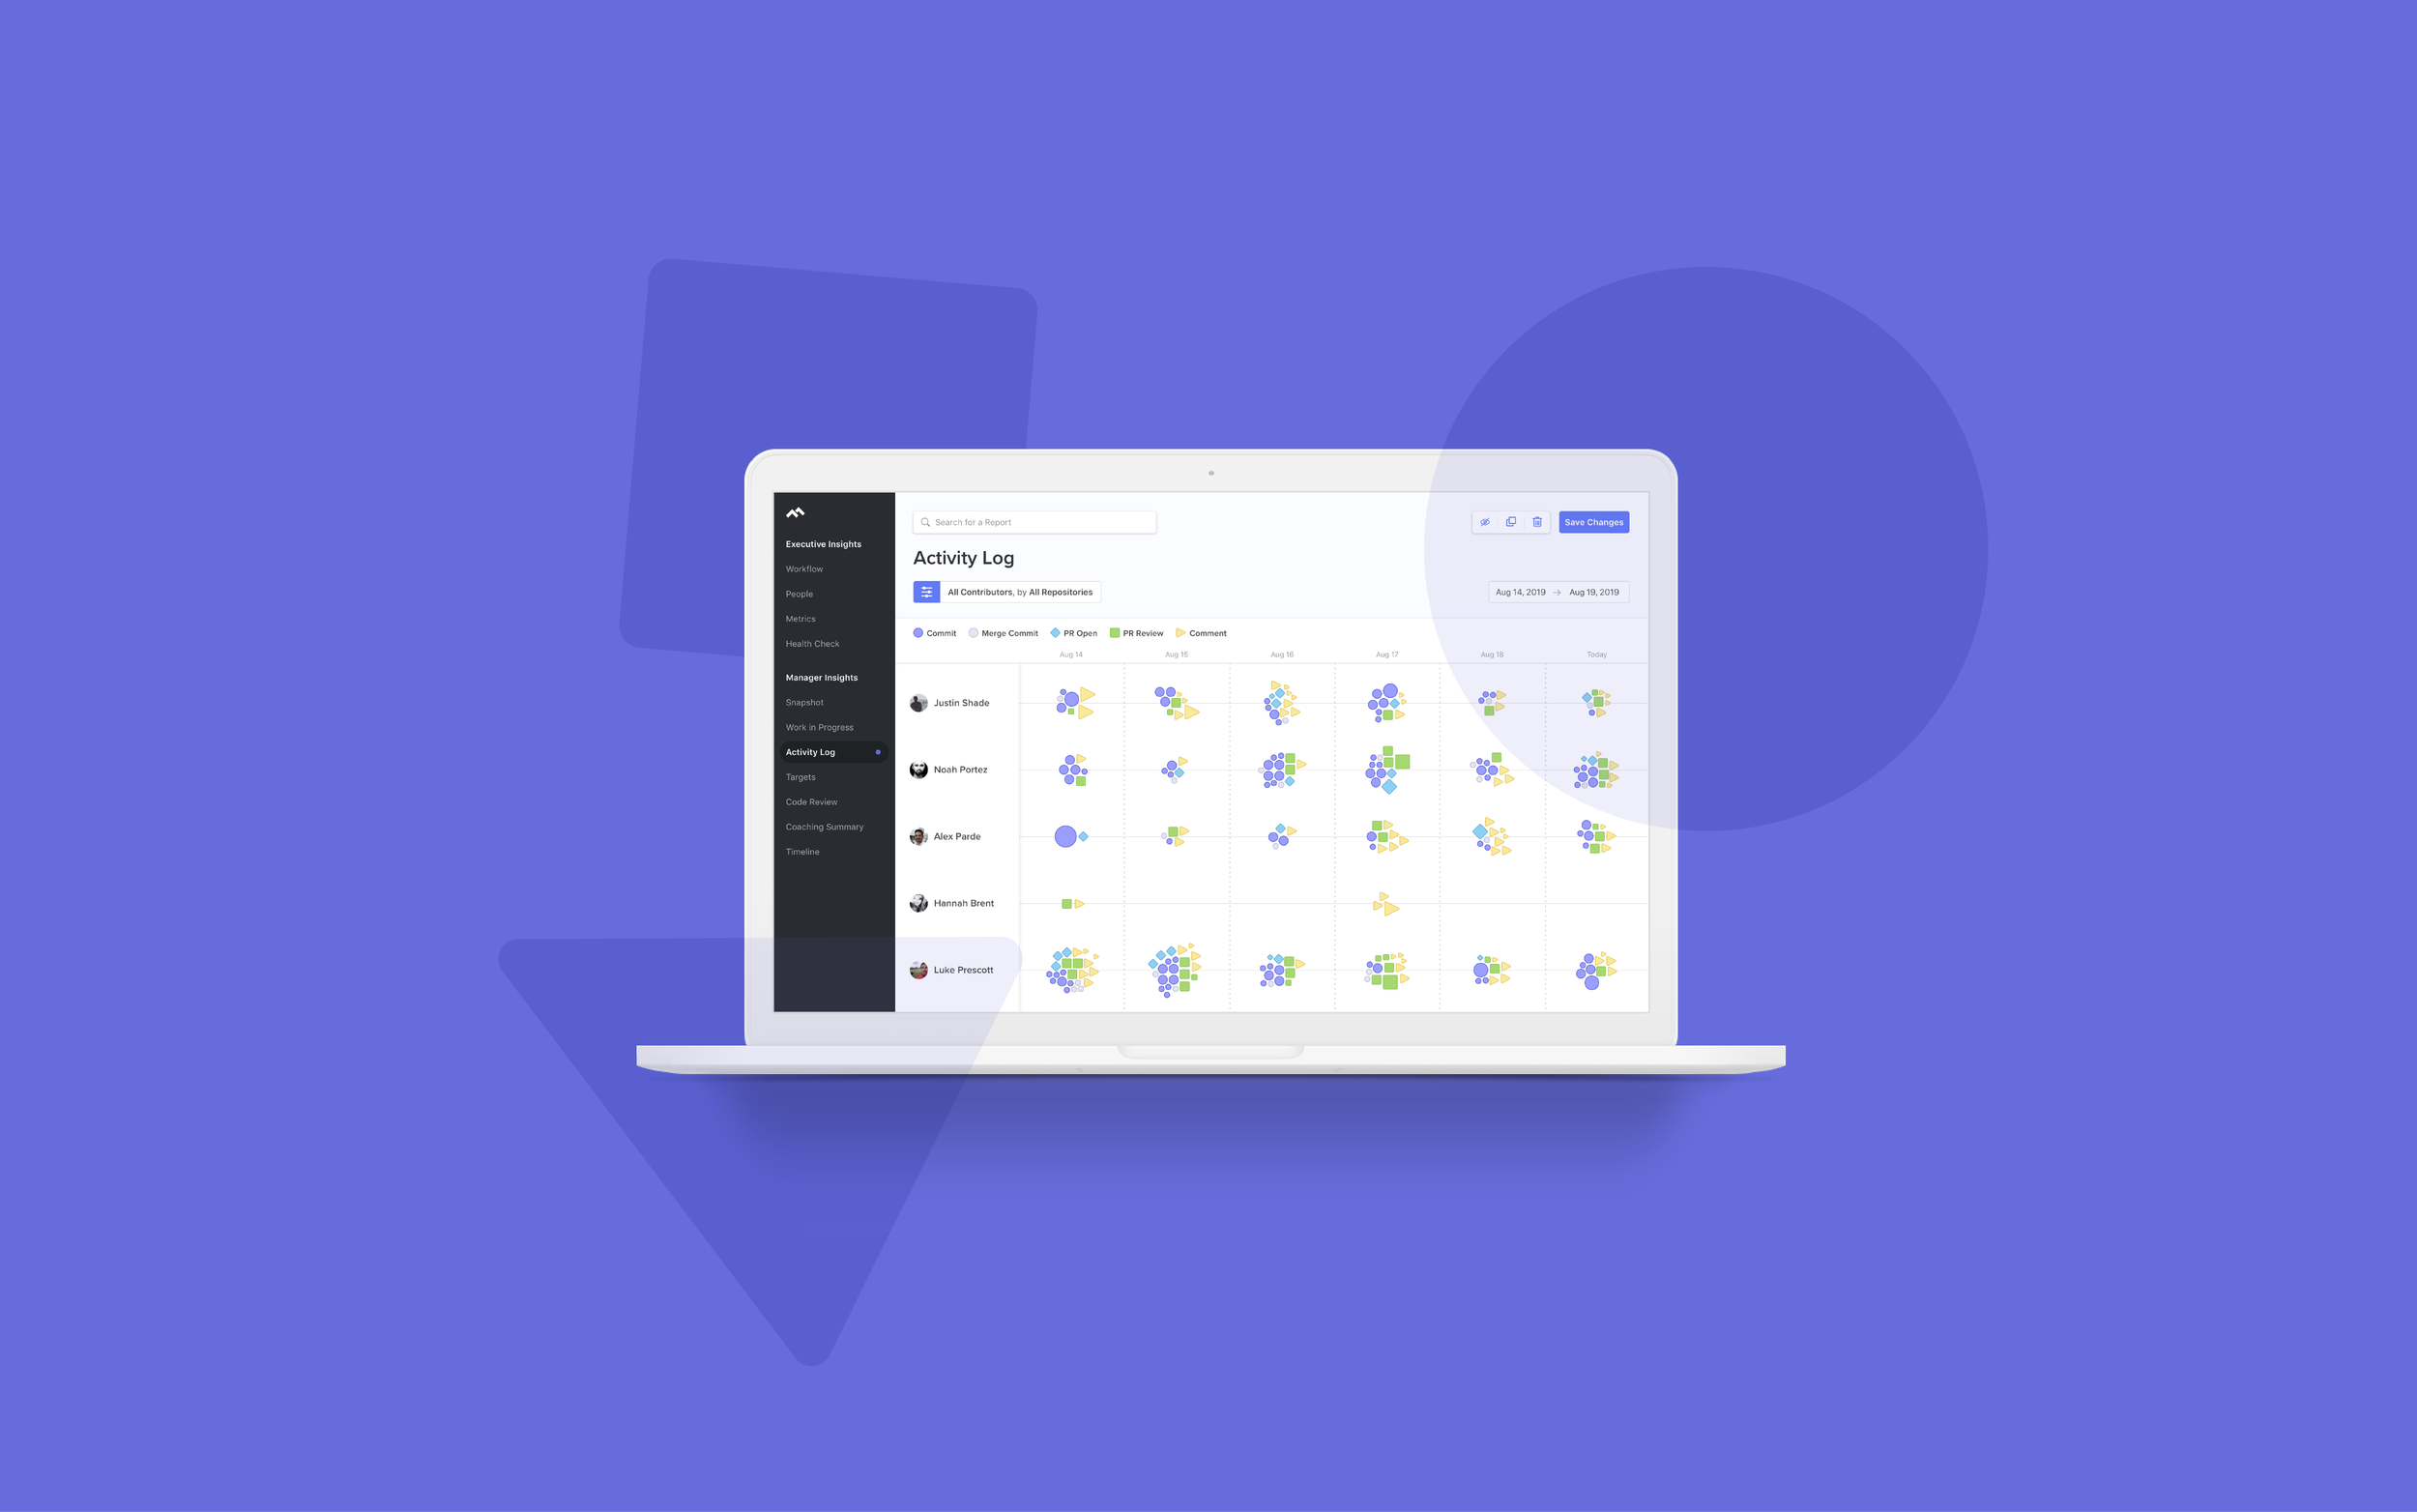
Activity Log Report
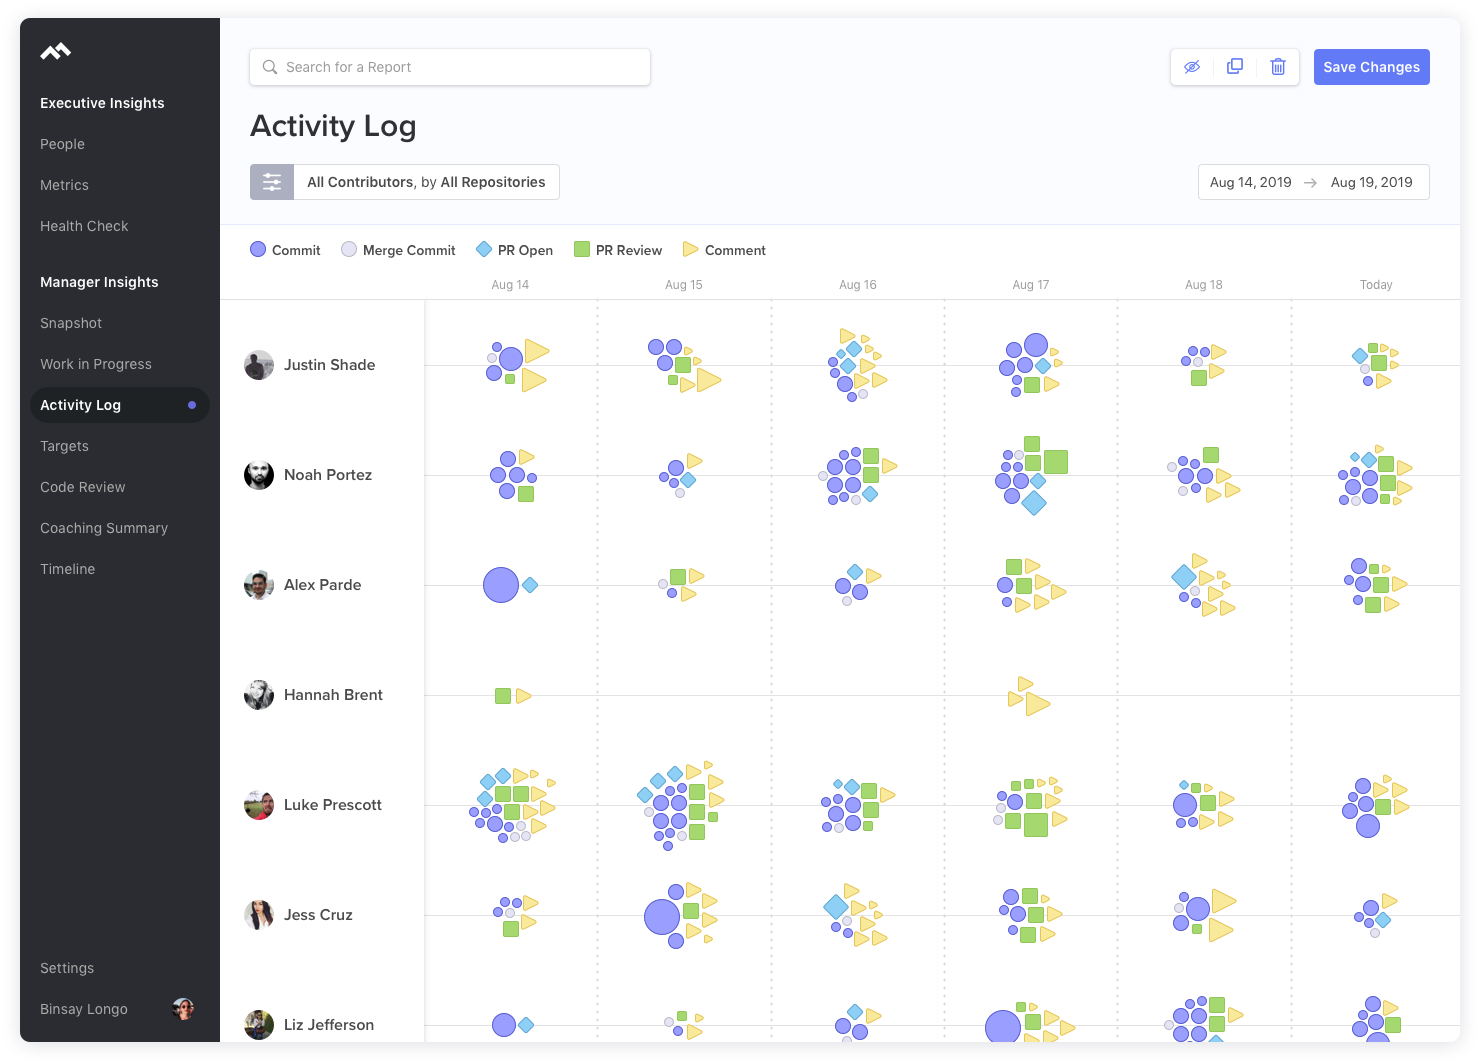
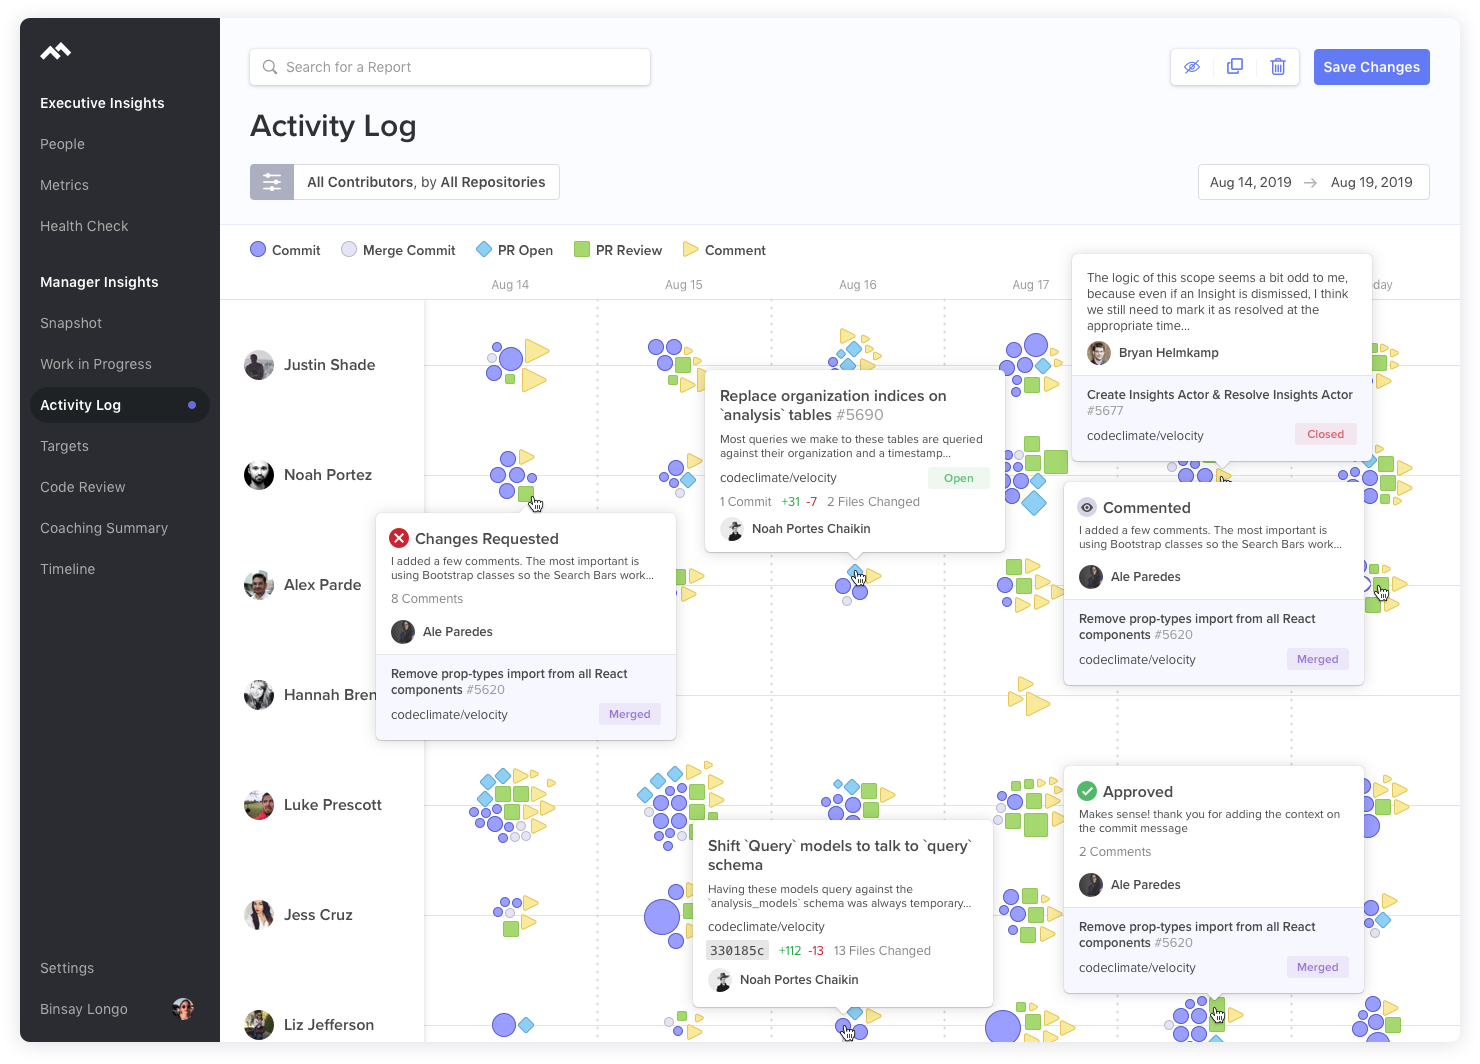
The Activity Log Report tracks your team’s contributions and work habits. Managers can get a quick glance at “a day in the life” of an engineers activity, have they been pushing commits, code reviews, issue comments? Or maybe there’s no activity which could mean an engineer is stuck.
The size of each shape in the cluster represents the magnitude of the activity. For example, larger blue diamonds represent larger pull requests.
PR Timeline Report
The PR Timeline Report allows Engineering Managers to take a deep dive into each individual pull request. Being able to oversee all the events happening such as commits, comments and reviews. Or the lack of— being able to see where activity might have dropped off.
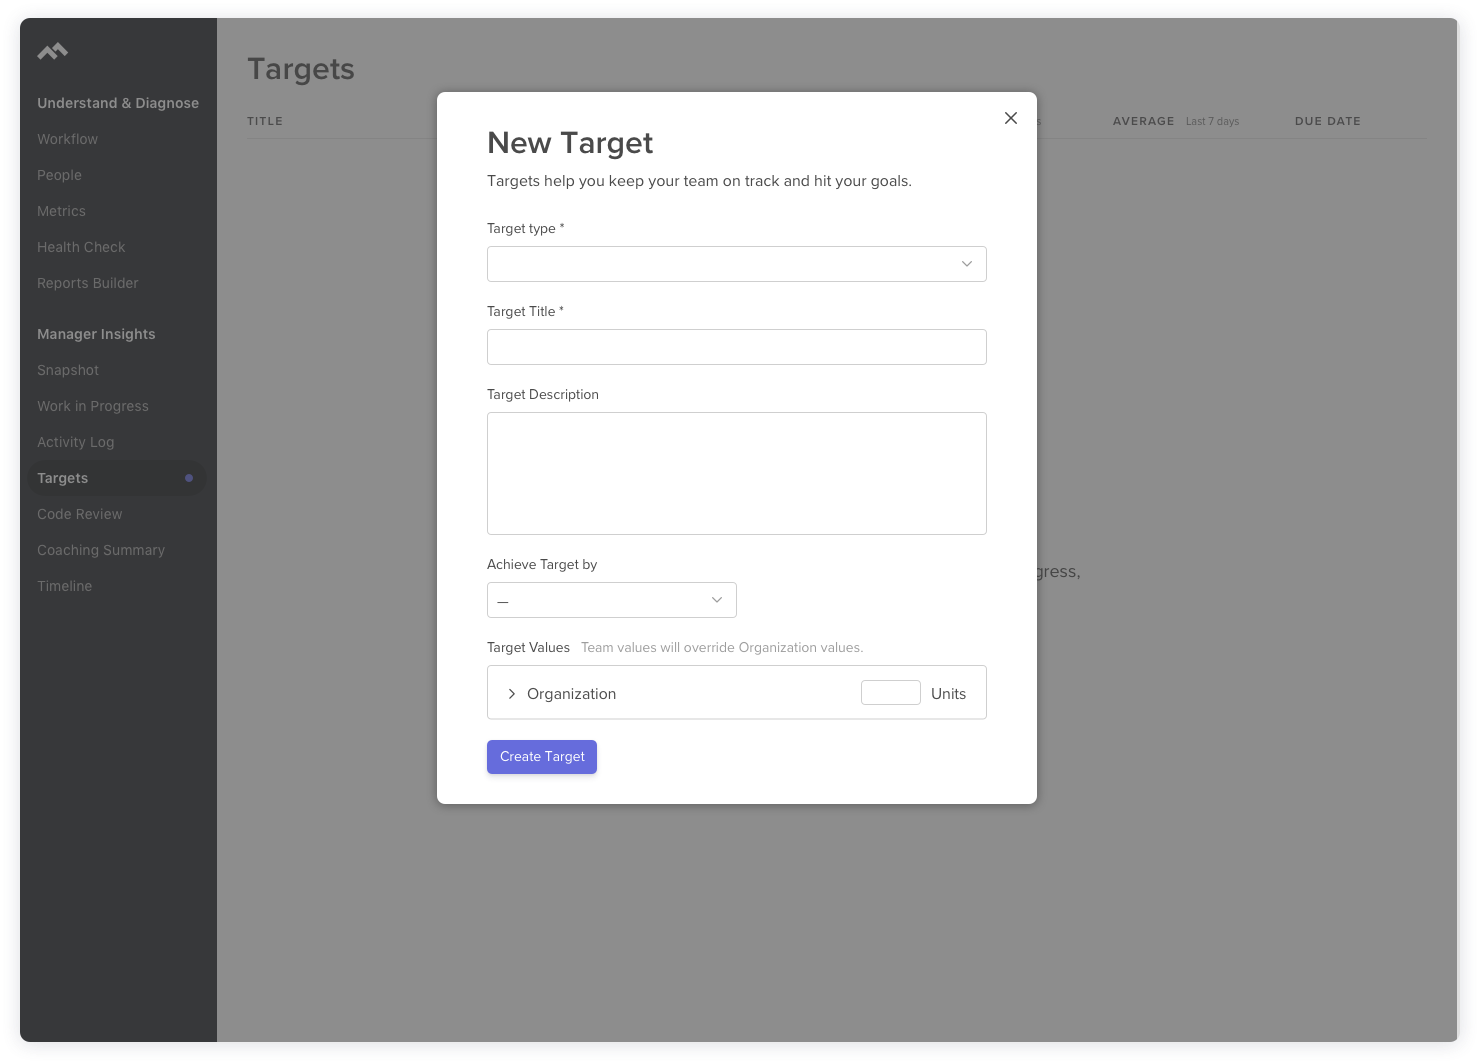
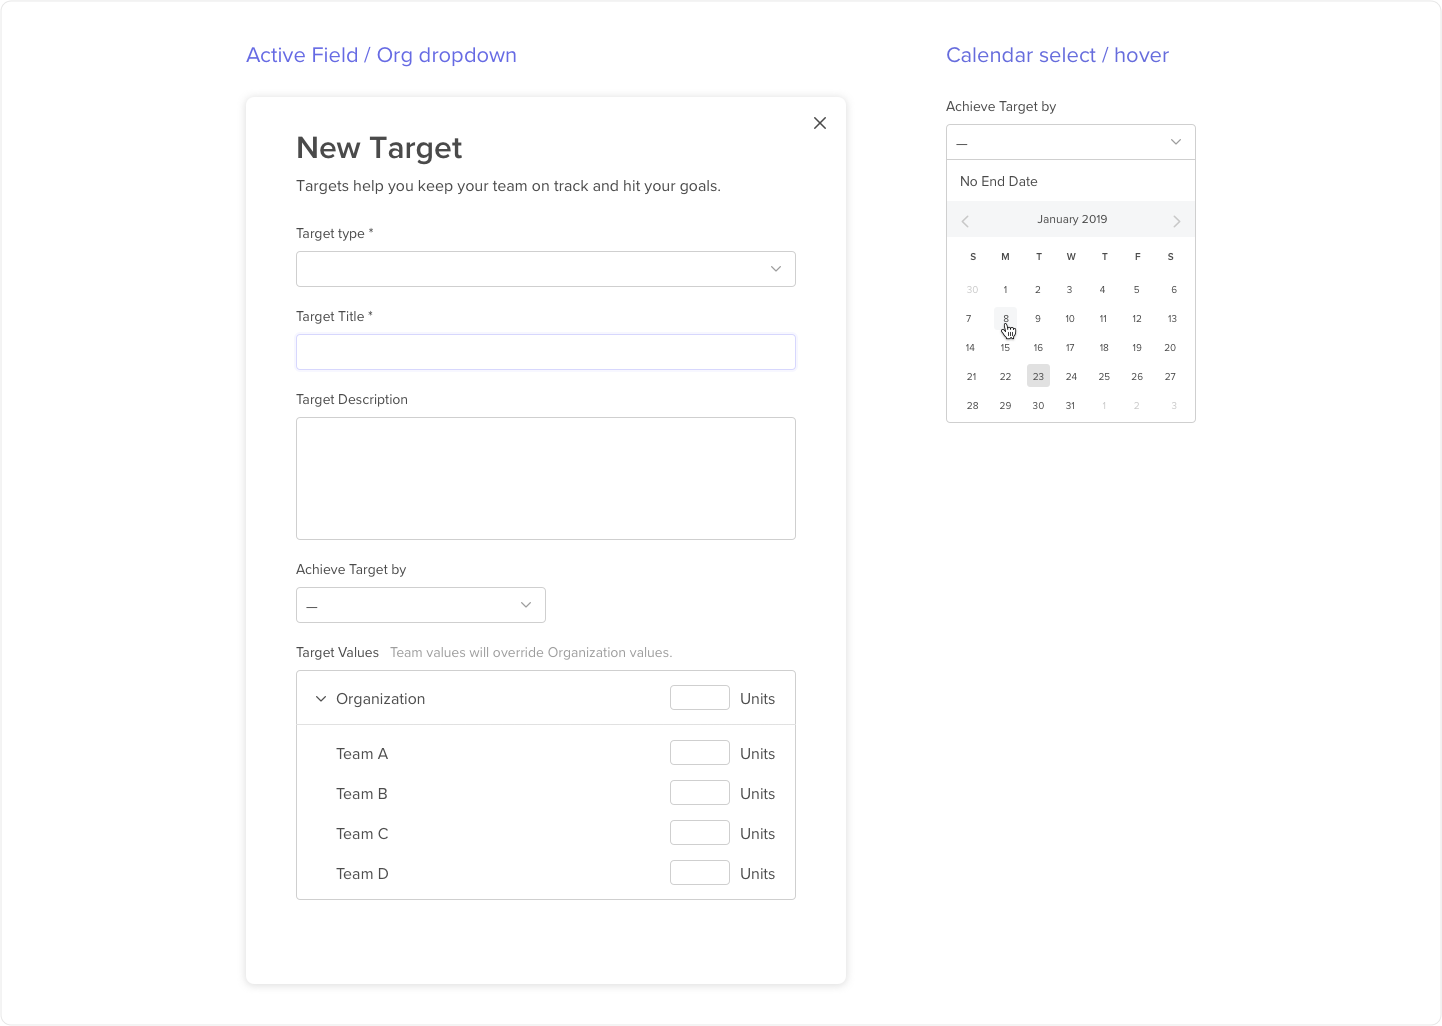
Targets
Engineering Managers use Targets to set goals for their whole organization or specific teams to meet over time or by a specific date.
Below is an example of what a new user will see if no targets have yet been created. Empty states can be a fun way to implement some personality by using illustrations, bringing a somewhat blank page to life.
When the user creates a new target they can either set it to be org wide, or assign it to specific teams.
After the user creates a target, they are shown listed with some easy-to-scan key metics.
Clicking into an individual target allows our user to take a deeper dive into these metrics to see how their teams are doing and if they are on track to achieve this target.
Trial Ended
After a User’s trial has ended they will be shown this screen to allow them to sign up.

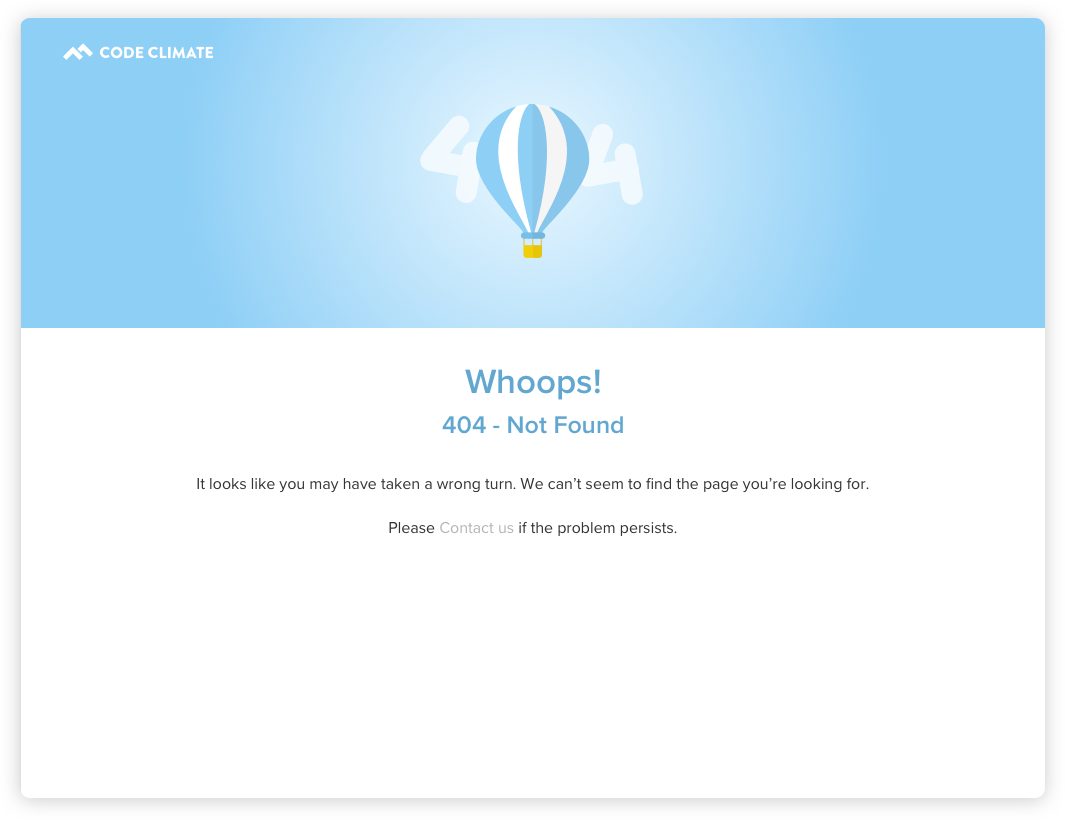
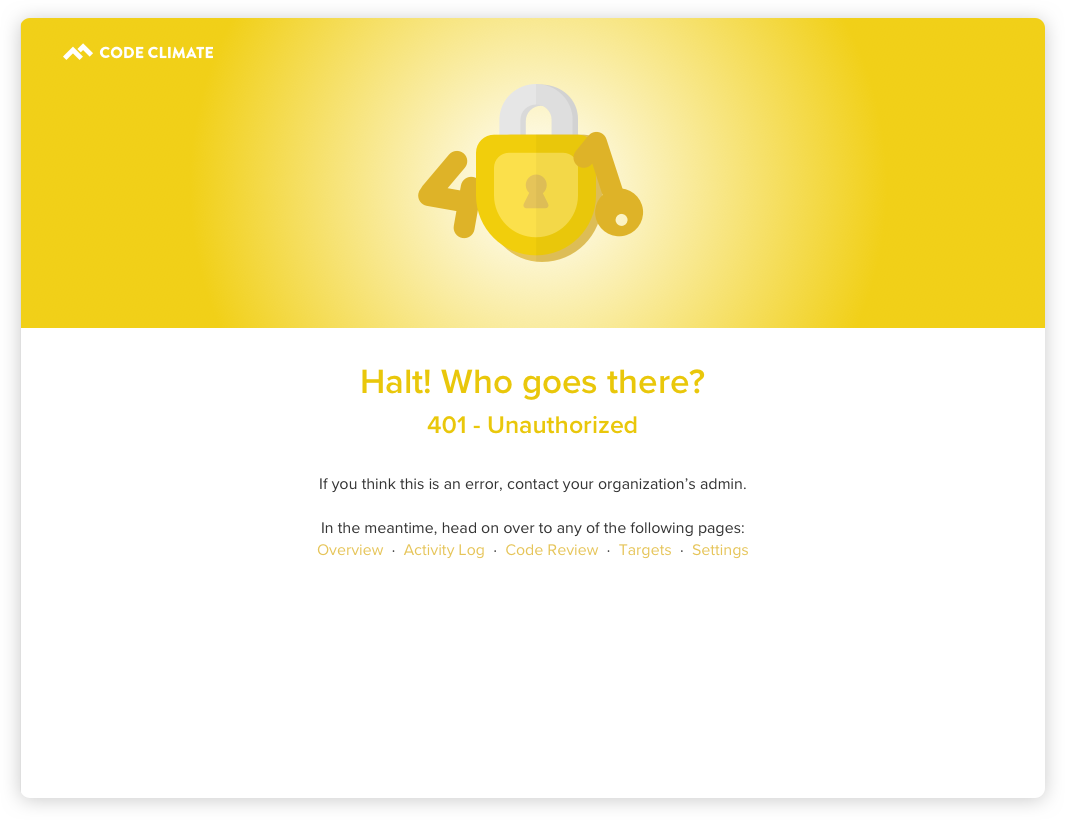
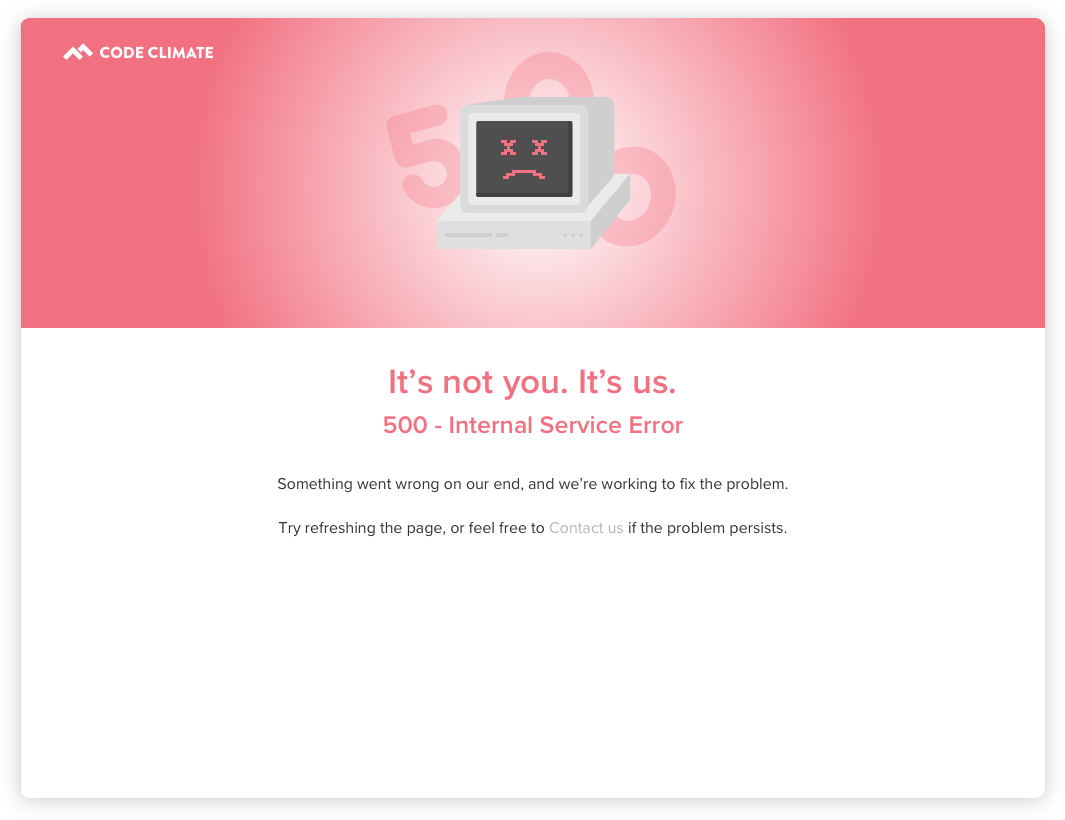
Error Pages
Creating error pages is also a good way to introduce some personality with fun illustrations, makes what is usually a boring page into something a bit more interesting!